Bluehost vs Togglebox
Go to provider selection to start a new comparison
We have tested 10 VPS plans from Bluehost and Togglebox. We'll show which one is best based on a detailed performance analysis, on features and prices.
Bluehost

Bluehost was founded as a VPS provider in 2003.
It is headquartered in the USA.
It employs 1000+ people.
It offers VPS, Shared, Dedicated and Wordpress and Managed Hosting hosting products.
- United States
Togglebox

Togglebox was founded as a VPS provider in 2003.
It is headquartered in the USA.
It offers VPS hosting products.
- United States
VPS Plans
| Plan Name | Monthly Price | CPU cores | Memory (GB) | Disk Space (GB) | Data Transfer (GB) | Latest trial | |
|---|---|---|---|---|---|---|---|
|
|
NVMe 2 | $5.50 | 1 | 2.0 | 50 | Unlimited | Feb 13 2026 |
|
|
1GB 1core | $10.50 | 1 | 1.0 | 20 | 10000 | Dec 08 2025 |
|
|
NVMe 4 | $11.00 | 2 | 4.0 | 100 | Unlimited | May 14 2026 |
|
|
2GB 1 core | $14.40 | 1 | 2.0 | 40 | 10000 | Mar 08 2026 |
|
|
4GB 2cores | $22.75 | 2 | 4.0 | 40 | 10000 | Jun 06 2026 |
|
|
8GB 4cores | $42.05 | 4 | 8.0 | 80 | 10000 | Oct 24 2025 |
|
|
NVMe 16 | $46.50 | 8 | 16.0 | 450 | Unlimited | Mar 31 2026 |
|
|
12GB 6cores | $63.35 | 6 | 12.0 | 120 | 10000 | Sep 09 2025 |
|
|
16GB 8 cores | $84.85 | 8 | 16.0 | 160 | 10000 | Jan 22 2026 |
|
|
20GB 10cores | $104.05 | 10 | 20.0 | 200 | 10000 | Apr 22 2026 |
Compare specs for all plans from all providers
Performance Grades
To summarize the performance of each VPS plan, we generated grades based on the various tests that were run: web, sysbench, endurance and remote timing tests. Each grade focuses on one aspect of the VPS speed or stability (cpu, disk IO, network IO...) and is made of one or more metrics measured during the tests.
Grades are evenly distributed between A and F. A is best, F is worst.
Follow the letter links to find the test results backing the grade.
Screen all VPS from Bluehost and Togglebox| Plan Name | Web Perf | Raw CPU Power | Perf Stability | Disk IO Perf | Network Perf | |
|---|---|---|---|---|---|---|
|
|
NVMe 2
$5.50 |
B | E | A | B | C |
|
|
1GB 1core
$10.50 |
E | F | E | C | E |
|
|
NVMe 4
$11.00 |
B | D | C | C | B |
|
|
2GB 1 core
$14.40 |
D | F | B | C | D |
|
|
4GB 2cores
$22.75 |
D | E | B | C | D |
|
|
8GB 4cores
$42.05 |
D | D | B | C | D |
|
|
NVMe 16
$46.50 |
A | A | A | B | C |
|
|
12GB 6cores
$63.35 |
D | C | C | B | D |
|
|
16GB 8 cores
$84.85 |
C | B | B | C | D |
|
|
20GB 10cores
$104.05 |
C | C | B | B | D |
Features and Data Centers
This list is a subset of the features each provider may offer.
CPUs
These are the CPUs we have seen in Bluehost and Togglebox instances in the past 18 months.
| Bluehost | Togglebox |
|---|---|
| All Bluehost CPUs by plan | All Togglebox CPUs by plan |
|
AMD EPYC 9J14 96-Core Processor AMD EPYC 9J45 128-Core Processor AMD EPYC-Genoa Processor |
Intel Core Processor (Broadwell, no TSX, IBRS) Intel Xeon Processor (Skylake, IBRS) Intel(R) Xeon(R) Gold 6238 CPU @ 2.10GHz Intel(R) Xeon(R) Gold 6238R CPU @ 2.20GHz |
Performance Consistency
The provider consistency score shows how much variation can be expected between 2 servers of the same type at the same provider. A high consistency score (>65) means the performance of all servers of the provider is consistent over many trials and many plans.
Providers who don't have enough data yet at VPSBenchmarks don't have a consistency score.
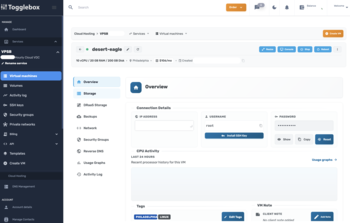
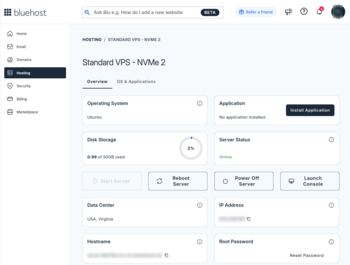
Screenshots
VPS Instance Provisioning Time
This is the average time it took to create an instance for Bluehost and Togglebox from instance order to instance accepting connections.
| Bluehost | Togglebox | |
|---|---|---|
| Number of instance creations in sample | 2 | 12 |
| Average provisioning time | 260s | 50s |
Performance in Depth...
These are some of the test results that are used to determine the grades above.
Web Response Times
We ran a database intensive web application at various levels of load on cloud servers from Bluehost and Togglebox. This is the average response time measured locally on the VPS for each plan we tested.
Local Response Time per Plan
Lower is better
Maximum HTTP Load
We ran a database intensive web application at various levels of load on cloud servers from Bluehost and Togglebox. This is the maximum rate of HTTP requests that each server handled without timing out.
Maximum HTTP request rate
Higher is better
Sysbench CPU Performance
We ran the full suite of Sysbench tests on VPS plans of Bluehost and Togglebox. These are the Sysbench CPU test results:
Rate of operations
Higher is better
Sysbench Disk IO Performance
We ran the full suite of Sysbench tests on VPS plans of Bluehost and Togglebox. These are the Sysbench Disk IO Random Read test results:
Rate of operations
Higher is better
Review and compare all Sysbench numbers on the Sysbench Comparison page for Bluehost and Togglebox.
Network Transfers
We have performed large file transfers from the Bluehost and Togglebox VPS and we measured the speed of downloads and uploads.
The transfers involve multiple files, 10 threads and last for at least 10 seconds at maximum speed. The transfers are repeated 3 times from different servers and only the fastest transfer is reported here.
Download Speed per Plan
Higher is better
Sustained CPU Endurance Tests
We pushed the CPU of those VPS plans hard for 24 hours straight.
This test shows how fast the VPS can go for long periods of time, how stable the performance is and it also gives clues on how overallocated the VPSs may be.
Throughput variations of the endurance test over 24 hours. The coefficient of variation is the standard deviation of the test throughput divided by its average value. Low variations mean that resources allocated to the server were stable for the duration of the test and there was little contention.
Ops/hour coefficient of variation
Lower is better
Having trouble finding the VPS that fits your needs?
Use the VPS Screener to quickly zero in on the specifications, performance and price that you're looking for.